MY

TIME

MATTERS

We have a problem with time.

Together, cities and citizens are solving it.

#MyTimeMatters

EU KEY
FINDINGS

Historically, Europe has positioned itself as a global benchmark for social welfare and quality of life.

Recently, this commitment has translated into work-life balance policies, achieving significant milestones. For instance, according
to Eurofound, the 
gender gap in unpaid childcare and household work has declined by 27% (approximately 1 h) in two decades.

But despite these advances, a deeper imbalance remains, affecting Europe’s competitiveness, equality,
democracy, health, and social cohesion. The following indicators reveal a pressing issue:
 Europe has a
problem with time, and addressing it is now urgent.

We are moving in the right direction, but we still have a problem with time.

#MyTimeMatters for Work, Care and Life

#MyTimeMatters for Health and Well-being

#MyTimeMatters for Leisure and Democracy

COUNTRY
COMPARISON

Across Europe, people share a common problem with time. But this challenge doesn’t look the same everywhere — each country has its own particularities.

For the first time, we present a clear and comprehensive picture of the main time-related issues across nine EU countries — which are all part of the Time4All 2.0 project — using the latest official European data.

The results show how time shapes daily life across Europe — and how experiences differ across borders and gender lines.

Time Use Indicators · timeuse.barcelona

European Time Use Indicators

EU Key Findings
Europe cannot find the work-life balance: 45% of Europeans struggle to balance work and life. Percentage (%) of respondents that experience difficulties in combining paid work and housework responsibilities
45% EU-27 Median
Total Female Male EU-27 Median · 45.0%
Notes

Calculations are based on microdata from the European Institute for Gender Equality (EIGE)'s 2022 Survey of gender gaps in unpaid care, individual and social activities. The survey was carried out in all 27 Member States of the European Union with a total sample size of more than 60,000 respondents aged 16–74.

The numbers indicate the percentage (%) of respondents, who are both employed and involved in housework, who reported experiencing difficulties combining paid work with housework responsibilities on the following frequencies: Every day; 4 to 6 days a week; 1 to 3 days a week.

Source: European Institute for Gender Equality (EIGE)

While many European workers ask for flexible hours, only 23% enjoy them. Workers that can adapt working hours within certain limits (e.g. flexitime), in percentage (%)
18.7% EU-28 Median
Total Female Male EU-28 Median · 18.7%
Notes

Calculations are based on microdata from the European Working Conditions Survey (EWCS), coordinated by Eurofound. The survey aims to represent the population of all employed persons aged 15 or older.

The question considered is "How are your working time arrangements set?", from the 2015 EWCS survey. The results indicate those who answered: can adapt working hours within certain limits (e.g. flexitime).

Source: Eurofound

61% of the working-age population spends around 240 hours a year commuting — 10 full days lost on the move. Population spending around 240 hours a year commuting, in percentage (%)
61.2% EU-27 Median
Total Female Male EU-27 Median · 61.2%
Notes

Calculations are based on microdata from the European Working Conditions Survey (EWCS), coordinated by Eurofound. The survey aims to represent the population of all employed persons aged 15 or older.

The question considered is "In total, how many minutes per day do you usually spend travelling from home to work and back?", from the 2024 EWCS survey. The results indicate the sum of respondents (%) who answered: 30 to 59 minutes; 1 to 2 hours.

Source: Eurofound

Most European working-age adults sleep under 8 hours a day, and 35% struggle with sleep deprivation. Daily sleep hours (hh:mm) — adults aged 30–50, with children, employed full-time, on working weekdays
<8h EU Average
Total Female Male 8h reference
Notes

Data from the Multinational Time Use Study (MTUS), in collaboration with the Centre for Time Use Research (CTUR). Sample: adults aged 30–50, with dependent children, employed full-time. Restricted to working weekdays only.

Country years: Germany (2012), Bulgaria (2001), Belgium (2013), France (2009), Spain (2009), Greece (2013), Italy (2008), Poland (2003). No data available for Portugal.

Source: Centre for Time Use Research (CTUR)

16% of Europeans cannot take part in democratic or civic life simply because they don't have the time. Persons not participating in active citizenship because they don't have time, in percentage (%)
16% EU-27 Median
Total Female Male EU-27 Median · 16.0%
Notes

Calculations are based on microdata from the European Union Statistics on Income and Living Conditions (EU-SILC) from 2022, carried out in all 27 Member States. Results are for all population aged 20 to 64.

The indicator considered is "Persons not participating in active citizenship by sex, age, educational attainment level and reasons". The EU figure is estimated by Eurostat. No data available for Germany.

Source: Eurostat

European women dedicate 1 hour and 24 minutes more every day — the equivalent of over 21 days — to unpaid domestic and childcare work compared to men. Gender gap in daily hours dedicated to unpaid work (childcare + housework), in hours:minutes (hh:mm)
1h 24m EU-28 Gender Gap
Gender gap (Women − Men) EU-28 gap · 1h 24m
Notes

Calculations are based on microdata from the European Working Conditions Survey (EWCS), coordinated by Eurofound. The survey represents all employed persons aged 15 or older.

Care work data refers exclusively to childcare activities. Questions from the 2015 EWCS: "On average, how many hours per day do you spend on caring for and/or educating your children, grandchildren?" and "On average, how many hours per day do you spend on cooking and housework?"

Source: Eurofound

77% of Europeans work at a fast pace or under strict deadlines, leading to time pressure and burnout. Population working to tight deadlines and at a very high speed, in percentage (%)
76.5% EU-28 Median
Total Female Male EU-28 Median · 76.5%
Notes

Calculations are based on microdata from the European Working Conditions Survey (EWCS), coordinated by Eurofound. The survey represents all employed persons aged 15 or older.

The results indicate the sum of respondents (%) who answered "Sometimes", "Often" or "Always" to the following questions from the EWCS 7th round 2021: "Does your job involve working to tight deadlines?" and "Does your job involve working at very high speed?"

Source: Eurofound

54% of teenagers devote around 6 hours daily to leisure screen time — almost a full day each week spent online. Teenagers devoting around 6 hours daily to leisure screen time, in percentage (%)
53.6% EU-26 Average
Total EU-26 Average · 53.6%
Notes

Calculations are based on microdata from PISA 2022 Results (Volume II), adapted from OECD (2023). The population is 15-year-olds.

The indicator considered is "Percentage of students who spent the following amount of time per week using digital devices for leisure". The results are the sum of those who responded: More than 20 hours and up to 40 hours; More than 40 hours and up to 60 hours.

Source: OECD PISA

59% of Europeans have worked during their free time to meet job demands. Population working in their free time to meet work demands, in percentage (%)
59% EU-28 Median
Total Female Male EU-28 Median · 59%
Notes

Calculations are based on microdata from the European Working Conditions Survey (EWCS), coordinated by Eurofound. The survey represents all employed persons aged 15 or older.

The results indicate the sum of all respondents (%) that didn't answer "never" to the following question from the EWCS 7th round 2021: "How often have you worked in your free time to meet work demands?"

Source: Eurofound

84% of Europeans support ending the biannual clock change — yet institutions still haven't reached an agreement. Population in favour of putting an end to bi-annual clock change, in percentage (%)
84% EU-28 Median
Total EU-28 Median · 84%
Notes

Calculations are based on the European Commission's Summertime Consultation on clock change in Europe. This online consultation ran from 4 July to 16 August 2018 and received 4.6 million responses from all 28 Member States — the highest number of responses ever received in any Commission public consultation.

The results indicate the sum of all respondents (%) who answered "to abolish" to the question: "Which of the following alternatives would you favour?"

Source: European Commission

COUNTRY
INSIGHTS

Explore Your Country's Time Profile.

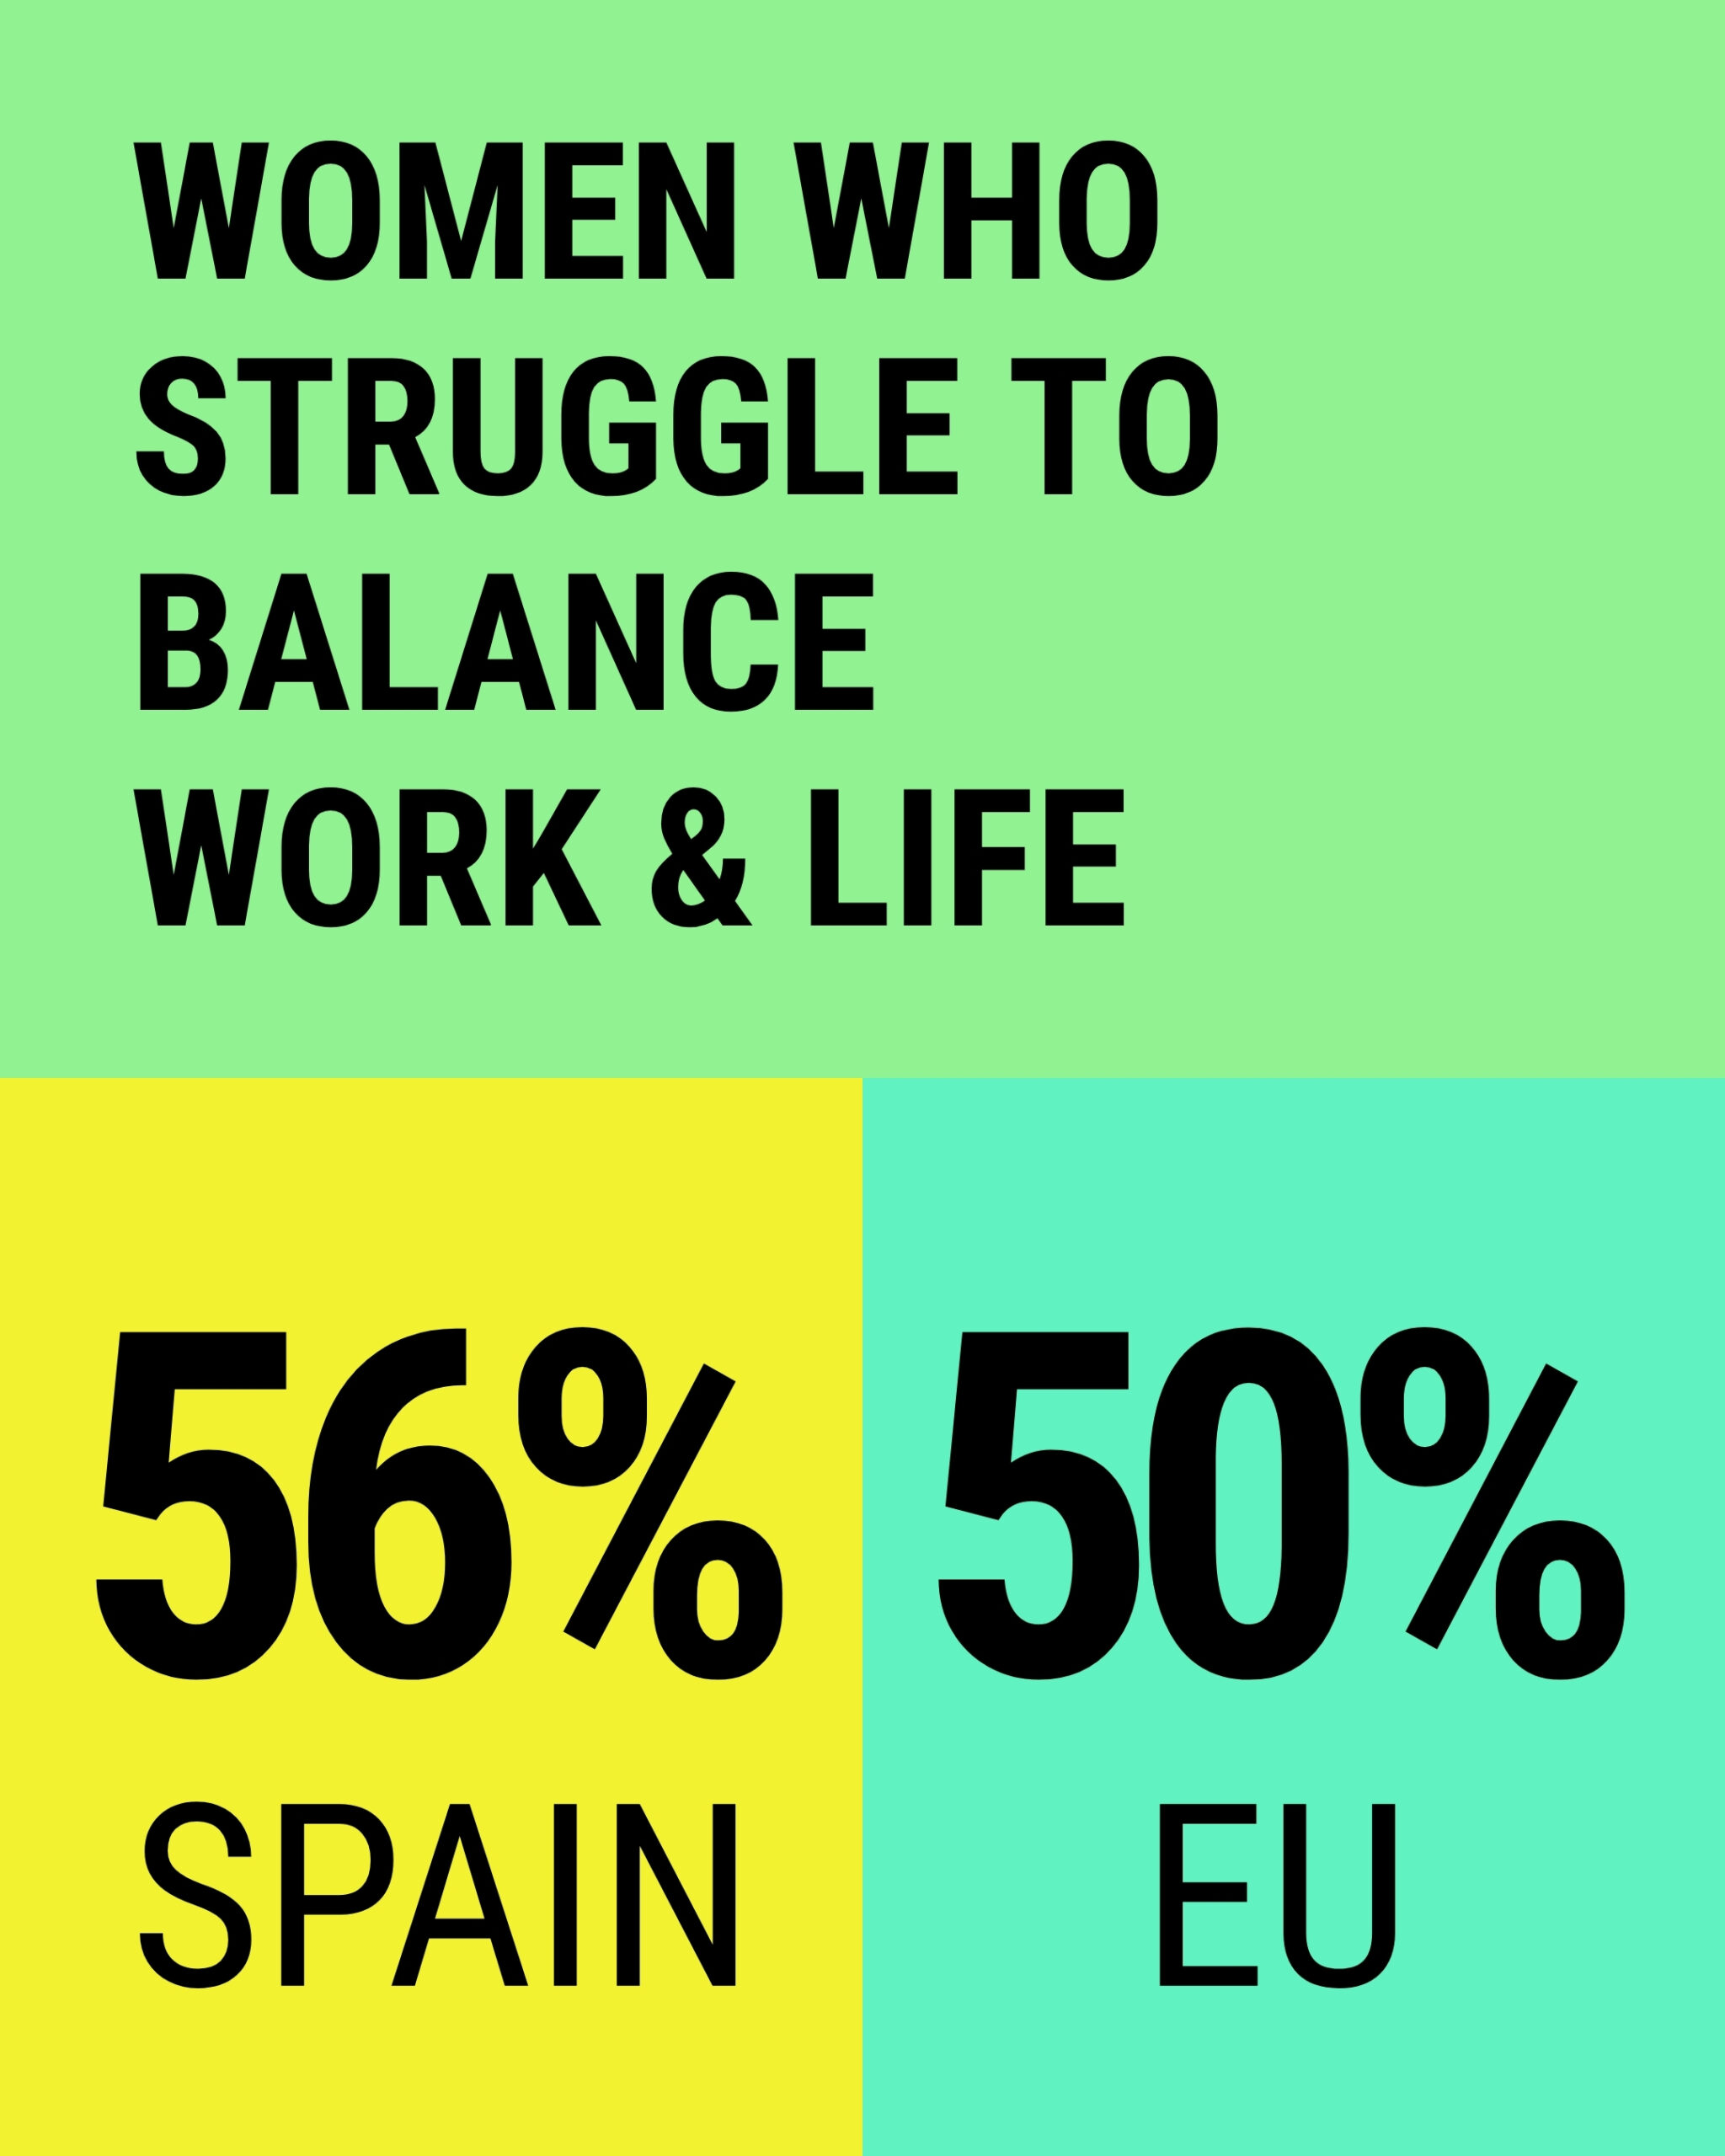
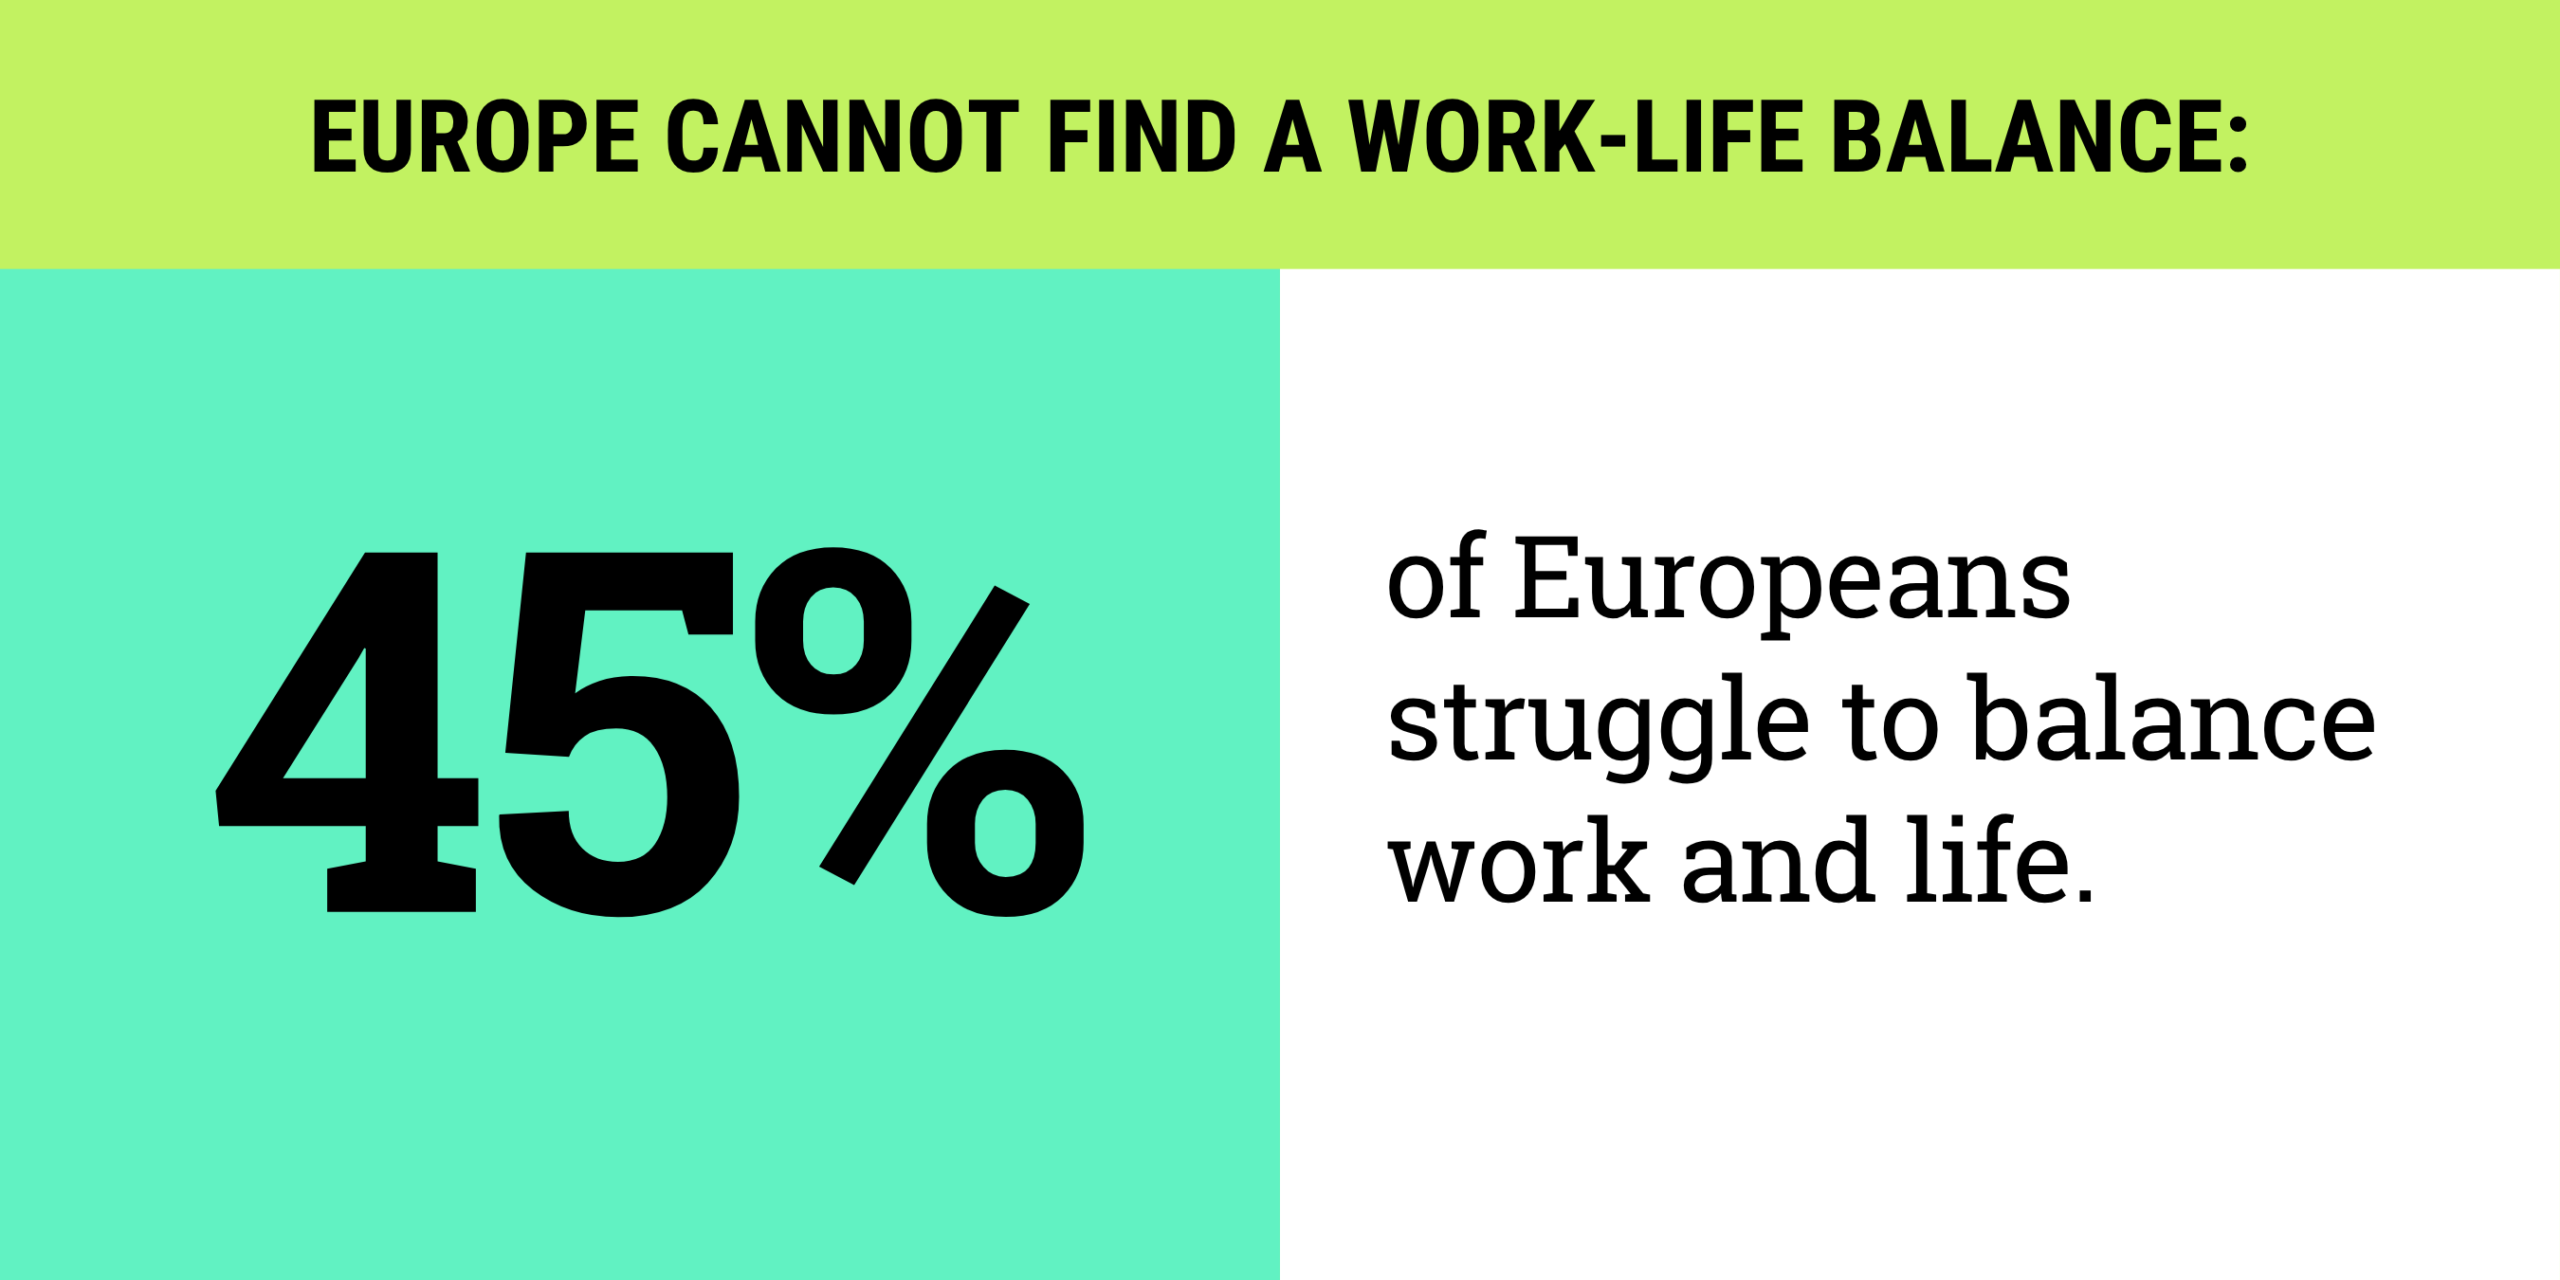
Beyond the general trends, each country faces its own nuanced problems with time.

Use this tool to select a nation and explore its unique time profile through two lenses: its standing compared to the European average and its internal gender disparities.

Explore the results to see where each country is making progress, which time problems remain most acute, and where action is needed to ensure time equality and well-being for all.

Spain
Time in Spain vs. EU
This table compares Spain's time indicators in relation to the EU average, identifying where results are better, similar, or worse.
BetterWorseSimilar
CommutingWork-life balanceSleeping hours
Civic participationTime flexibilityUnpaid work
Screen timeBurnout
Biannual Clock-change*Overtime
Countries within ±0.5 standard deviations of the EU average were classified as similar. *In Spain, there is more citizen support for ending the biannual clock-change.
Spain's Gender Time Gap
This table examines gender disparities in Spain, identifying where women or men are better off compared to the other gender, and where results are similar.
Men BetterSimilarWomen Better
Work-life balanceCommutingOvertime
Time flexibilitySleeping hours
Unpaid workCivic participation
Burnout
Countries with gender gaps within ±0.5 standard deviations from zero, based on the distribution of gender gaps across countries, were classified as showing similar outcomes between women and men.
Italy
Time in Italy vs. EU
This table compares Italy's time indicators in relation to the EU average, identifying where results are better, worse, or similar.
BetterWorseSimilar
CommutingWork-life balanceCivic participation
Sleeping hoursTime flexibilityBurnout
Unpaid workScreen time
Overtime
Biannual Clock-change*
Countries within ±0.5 standard deviations of the EU average were classified as similar. *In Italy, there is less citizen support for ending the biannual clock-change.
Italy's Gender Time Gap
This table examines gender disparities in Italy, identifying where women or men are better off compared to the other gender, and where results are similar.
Men BetterSimilarWomen Better
Work-life balanceBurnoutTime flexibility
Unpaid workCommuting
Sleeping hours
Civic participation
Overtime
Countries with gender gaps within ±0.5 standard deviations from zero, based on the distribution of gender gaps across countries, were classified as showing similar outcomes between women and men.
Bulgaria
Time in Bulgaria vs. EU
This table compares Bulgaria's time indicators in relation to the EU average, identifying where results are better, worse, or similar.
BetterWorseSimilar
Sleeping hoursWork-life balanceCommuting
Civic participationTime flexibilityScreen time
BurnoutUnpaid workOvertime
Biannual Clock-change*
Countries within ±0.5 standard deviations of the EU average were classified as similar. *In Bulgaria there is similar citizen support for ending the biannual clock-change.
Bulgaria's Gender Time Gap
This table examines gender disparities in Bulgaria, identifying where women or men are better off compared to the other gender, and where results are similar.
Men BetterSimilarWomen Better
Work-life balanceTime flexibilityOvertime
Unpaid workCommuting
BurnoutSleeping hours
Civic participation
Countries with gender gaps within ±0.5 standard deviations from zero, based on the distribution of gender gaps across countries, were classified as showing similar outcomes between women and men.
Belgium
Time in Belgium vs. EU
This table compares Belgium's time indicators in relation to the EU average, identifying where results are better, worse, or similar.
BetterWorseSimilar
Time flexibilityOvertimeWork-life balance
Civic participationCommuting
Unpaid workSleeping hours
Burnout
Screen time
Biannual Clock-change*
Countries within ±0.5 standard deviations of the EU average were classified as similar. *In Belgium there is similar citizen support for ending the biannual clock-change.
Belgium's Gender Time Gap
This table examines gender disparities in Belgium, identifying where women or men are better off compared to the other gender, and where results are similar.
Men BetterSimilarWomen Better
Work-life balanceCivic participationTime flexibility
Unpaid workBurnoutCommuting
OvertimeSleeping hours
Countries with gender gaps within ±0.5 standard deviations from zero, based on the distribution of gender gaps across countries, were classified as showing similar outcomes between women and men.
Greece
Time in Greece vs. EU
This table compares Greece's time indicators in relation to the EU average, identifying where results are better, worse, or similar.
BetterWorseSimilar
CommutingWork-life balanceScreen time
Sleeping hoursTime flexibility
Civic participationUnpaid work
Burnout
Overtime
Biannual Clock-change*
Countries within ±0.5 standard deviations of the EU average were classified as similar. *In Greece there is less citizen support for ending the time change.
Greece's Gender Time Gap
This table examines gender disparities in Greece, identifying where women or men are better off compared to the other gender, and where results are similar.
Men BetterSimilarWomen Better
Work-life balanceTime flexibilityCivic participation
CommutingSleeping hoursOvertime
Unpaid workBurnout
Countries with gender gaps within ±0.5 standard deviations from zero, based on the distribution of gender gaps across countries, were classified as showing similar outcomes between women and men.
Germany
Time in Germany vs. EU
This table compares Germany's time indicators in relation to the EU average, identifying where results are better, worse, or similar.
BetterWorseSimilar
Work-life balanceCommutingBurnout
Time flexibilitySleeping hoursOvertime
Unpaid workScreen timeBiannual Clock-change*
Countries within ±0.5 standard deviations of the EU average were classified as similar. *In Germany there is similar citizen support for ending the biannual clock-change.
Germany's Gender Time Gap
This table examines gender disparities in Germany, identifying where women or men are better off compared to the other gender, and where results are similar.
Men BetterSimilarWomen Better
Work-life balanceCommutingSleeping hours
Time flexibilityBurnout
Unpaid workOvertime
Countries with gender gaps within ±0.5 standard deviations from zero, based on the distribution of gender gaps across countries, were classified as showing similar outcomes between women and men.
France
Time in France vs. EU
This table compares France's time indicators in relation to the EU average, identifying where results are better, worse, or similar.
BetterWorseSimilar
CommutingCivic participationWork-life balance
Unpaid workOvertimeTime flexibility
Sleeping hoursBurnout
Screen timeBiannual Clock-change*
Countries within ±0.5 standard deviations of the EU average were classified as similar. *In France there is similar citizen support for ending the biannual clock-change.
France's Gender Time Gap
This table examines gender disparities in France, identifying where women or men are better off compared to the other gender, and where results are similar.
Men BetterSimilarWomen Better
Work-life balanceTime flexibilitySleeping hours
Unpaid workCommutingBurnout
Civic participation
Overtime
Countries with gender gaps within ±0.5 standard deviations from zero, based on the distribution of gender gaps across countries, were classified as showing similar outcomes between women and men.
Poland
Time in Poland vs. EU
This table compares Poland's time indicators in relation to the EU average, identifying where results are better, worse, or similar.
BetterWorseSimilar
Biannual Clock-change*Time flexibilityWork-life balance
Sleeping hoursCommuting
Civic participationUnpaid work
Screen timeBurnout
Overtime
Countries within ±0.5 standard deviations of the EU average were classified as similar. *In Poland there is more citizen support for ending the biannual clock-change.
Poland's Gender Time Gap
This table examines gender disparities in Poland, identifying where women or men are better off compared to the other gender, and where results are similar.
Men BetterSimilarWomen Better
Work-life balanceBurnoutCommuting
Time flexibilitySleeping hours
Unpaid workCivic participation
Overtime
Countries with gender gaps within ±0.5 standard deviations from zero, based on the distribution of gender gaps across countries, were classified as showing similar outcomes between women and men.
Portugal
Time in Portugal vs. EU
This table compares Portugal's time indicators in relation to the EU average, identifying where results are better, worse, or similar.
BetterWorseSimilar
CommutingWork-life balanceScreen time
BurnoutTime flexibilityBiannual Clock-change*
Unpaid work
Civic participation
Overtime
Countries within ±0.5 standard deviations of the EU average were classified as similar. *In Portugal there is similar citizen support for ending the biannual clock-change.
Portugal's Gender Time Gap
This table examines gender disparities in Portugal, identifying where women or men are better off compared to the other gender, and where results are similar.
Men BetterSimilarWomen Better
Work-life balanceBurnout
Time flexibilityOvertime
Commuting
Civic participation
Unpaid work
Countries with gender gaps within ±0.5 standard deviations from zero, based on the distribution of gender gaps across countries, were classified as showing similar outcomes between women and men.

TIME
SOLUTIONS

Europe is facing a major time challenge, but solutions are already underway. Across the continent, cities and citizens are working together to implement innovative time policies.

These policies aim to improve everyday life by rethinking how daily schedules and social
rhythms are organised. In doing so, they can help create societies that are 
more equal, sustainable,
efficient, democratic and healthy
, while also addressing major challenges such as the climate and care crises.

Although these initiatives are led by different actors and sectors, they share a common message: time matters. Here, you can
explore
10 key examples of time policies.

Biblioteques obertes durant la nit — Open libraries at nighttime

Transformative Prevention of Gender-Based Violence in Night-Time Leisure Venues

The Milan Movida — Nightlife MoU

Conseil de la Nuit — Night Council

Politiche per la socialità notturna — Night Socializing Policies

Bologna Night Plan

Open schools

Women’s Municipal Plenary Session

Barcelona’s Participatory Budgeting

Plataforma Participa311: La Participació Digital a la Província de Barcelona — Participa311 Platform: Online Participation

DECIDIM Catalunya — “Decide” Service

JOIN US

Across the continent, cities,
organisations, and citizens are teaming up to rethink the clock.

Dive into our social wall to see the #MyTimeMatters campaign in action.

Want to join? Your voice counts! Share your experience using
#MyTimeMatters.

If you are a city:

More to know:

Suscribe to our newsletter:

Scroll to Top
Privacy summary

This website uses cookies so that we can provide you with the best possible user experience. Cookie information is stored in your browser and performs functions such as recognising you when you return to our website or helping our team understand which parts of the site you find most interesting and useful.